Library — Energy and infrastructure
Ageing infrastructure, read in real time
Grids, pipelines and plants were built to last decades, and many have. Keeping them running now depends on knowing which assets are closest to their limits.
01The problem
Critical infrastructure is rarely short of data. It is short of a way to read it together.
SCADA readings, inspection records, maintenance histories and outage logs accumulate in separate systems. What is missing is the reading that sees a transformer running warm, a deferred inspection and a forecast spell of extreme heat as one risk rather than three unrelated entries.
Maintenance budgets are finite and the asset base keeps ageing. The operators who spend them best are the ones who can show, with evidence, which assets matter most, which are declining fastest and what a failure would reach.
Infrastructure rarely fails without warning. The warning is just spread across too many systems to hear.
02How it plays out
A network operator maintains several hundred substations. Its inspection programme is drawn up a year in advance.
An illustrative sequence, not a customer account.
The signal
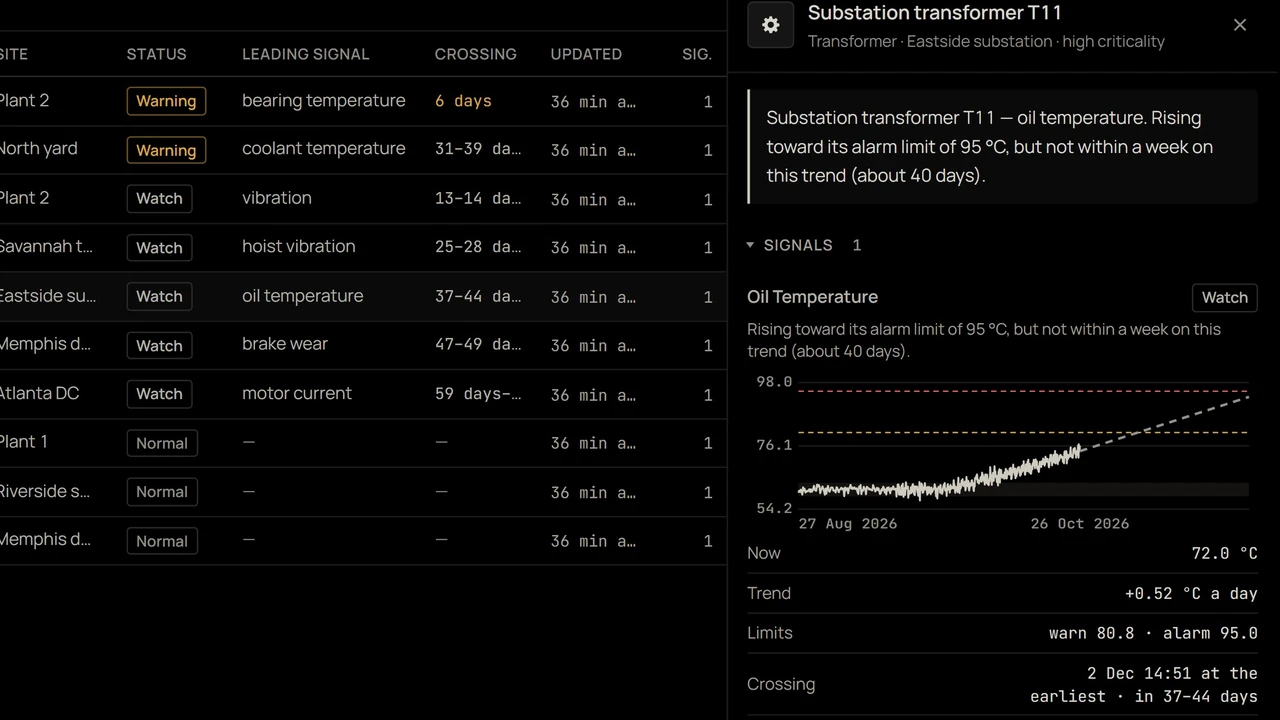
One transformer’s oil temperature has been creeping upward through the spring. Its last inspection was deferred. The forecast now shows a week of exceptional heat.
What it means
On its own, none of this stands out: the temperature is within limits, deferrals are common, and heat is a forecast rather than an event. Read together, and against what depends on that transformer — a hospital feeder, a water treatment works and a second substation with no alternative supply — they describe the most consequential risk in the region for the next fortnight. Integrity Intelligence first checks that the trend is real rather than a drifting sensor, so the conclusion does not rest on a faulty instrument.
What is recommended
Bring the deferred inspection forward ahead of the heat, prepare a load transfer for the dependent substation, and push a lower-criticality inspection back to make room. Each step comes with its evidence and a stated confidence.
What follows
The inspection finds a cooling fault, repaired in a planned outage. The heatwave passes without an interruption.
The maintenance budget did not grow. It was spent where the evidence said it would remove the most risk.
On your network
We'd rank your assets by what their failure would reach.
Condition, load, weather and criticality read together, so the inspection programme follows the risk rather than last year's calendar, and leadership sees the same picture the field does.
- Condition across every system you record it in
- Criticality weighed alongside condition
- Maintenance sent where it counts
A screen from Terra, on synthetic data.
03Where Theralon applies
- 01
Condition across systems
SCADA telemetry, inspection results and maintenance history combined into one reading of each asset’s state.
- 02
Criticality, not only condition
A declining asset weighed by what depends on it — sites, customers, other assets — rather than by its condition alone.
- 03
Load and weather
Asset condition read against forecast load and conditions, so stress is anticipated rather than recorded afterwards.
- 04
Maintenance where it counts
Finite maintenance effort directed to the assets where it removes the most exposure.
- 05
Data worth trusting
Sensor gaps, stuck readings and inconsistent records flagged, so a decision is never built on a faulty instrument.
04What changes
Condition in one system, criticality in another
Both in a single reading
Maintenance by calendar
Maintenance by exposure
Every sensor trusted by default
Data validated before it is used
05Under the hood
Integrity Intelligence validates operational data itself — anomalies, missing events and unexpected behaviour — so the forecasts built on top of it rest on inputs that can be trusted. Deployment region is an explicit, disclosed setting, and every change to the model is recorded in a single tamper-evident history.

Two questions
- Does anything tell you which of your assets would reach the most customers if it failed this month?
- When load and weather change, does your inspection programme change with them?
Theralon does both. See it on your network.
Show us where the operation breaks down. We build around your data, your systems and how you actually operate, at whatever size the operation is. Then compare it with what you run today.
There's no cost while we work with you, for the foreseeable future. You see what the software does on your own operation before it costs you anything.
When it has shown its value there, we agree terms with you, sized to what you run, and nothing becomes a contract until you agree to it.